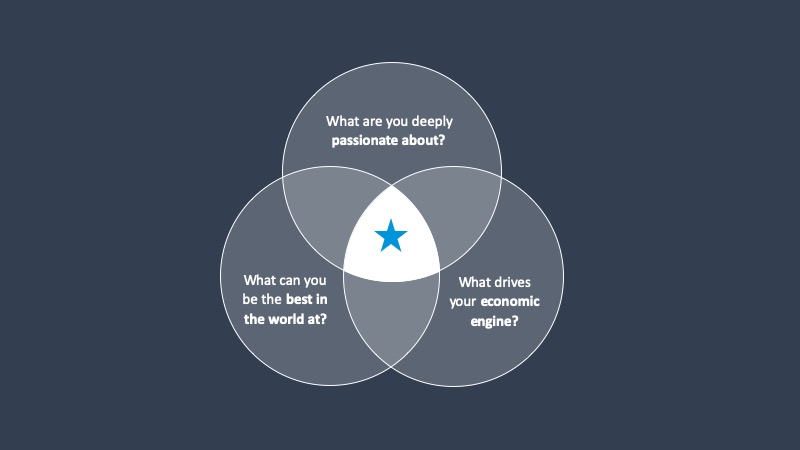
In our two previous posts we covered the first two elements of the Hedgehog Concept namely defining “What you are deeply passionate about” (Your Core Purpose) and then figuring out “What you can be the best in the world at”
The third and crucial circle covers defining “What drives your economic engine”?
In “Good to Great”, Jim Collins explains how each good-to-great company attained a deep understanding of the key drivers of its economic engine and built its system in accordance with this understanding. In fact, all the companies studied by Collins and his team had their own version of an economic denominator.
To quote from Good to Great “Think about it in terms of the following question: If you could pick one and only one ratio-profit per x (or, in the social sector, cash flow per x) – to systematically increase over time, what x would have the greatest and most sustainable impact on your economic engine? “.
A good example of this is the darling of strategy case-studies, Southwest Airlines. In a highly competitive market, where most airlines measure Revenue per Passenger Seat or Profit per Seat or Profit per Kilometre, Southwest bucked the system and set their key metric as Profit per Aircraft. Take a moment to consider the power of this metric. What does it take to improve Profit per Aircraft? Pricing, frequency of flights, customer service, customer loyalty, airport turn-around times, maintenance costs, routing etc. All of these aspects impact the company’s Profit per X and reflects the performance of its strategy.
All Star Cheerleaders, an amazing business which operates across New Zealand, Australia and parts of the USA measures Profit per Class which clearly represents the economic driver of their business. As per Southwest, when diving deeper into the mechanics of this ratio, it reflects how they are performing across a range of key areas. For example, athlete acquisition and retention, pricing, quality and range of programmes offered, customer satisfaction, class utilisation, asset utilisation and so on.
Not only is the ratio all-telling but it’s also understood by all staff – everyone, no matter what their role, understands the importance of All Stars Profit per X and which levers they can personally pull to impact this number.
When defining your Profit per X consider the numerator can be any metric for example – net profit, revenue, gross profit etc. – the denominator, however, is fixed and represents your company’s unique approach to scaling the business.
Here are some examples:
- Contribution Margin/client*
- Net Profit/FTE
- Revenue/Client
- Gross Profit/Student
- Net Profit % /Customer per Month
- Gross Profit/Recurring Revenue Customer/Month
- Gross Profit/Labour Revenue Hour
- Contribution Margin/Project*
*Several companies we work with use Contribution Margin as the numerator. Contribution Margin is a very effective measure since it includes Direct Labour in the calculation so referencing three major commercial drivers i.e. Revenue, Direct Costs and Direct Labour expenses
Our next post will explain how having a clear understanding of your Hedgehog can lead to the definition of your Big Hairy Audacious Goal (BHAG)